How to diagnose a .net process running inside Kubernetes/docker
Let’s say we have deployed our .net application into a pod that runs in Kubernetes (or a docker container) and somehow our users report some sort of slowness in that application. How do we find out the problem? Let’s find out, step by step!
-
Login to a terminal in your container: If you use Kubernetes, make sure you have your kube .config is ready and deployed in ~/.kube/config. If you do use WSL with docker desktop, the /.kube/config file is shared within windows and WSL.
List the pods with the below command:
kubectl get pods -n <target-namespace>Then find the relevant container from the list and login into it with:
kubectl exec --stdin --tty <podname> -- /bin/bashIf you don’t run Kubernetes but just docker use:
docker exec -it <container_id> /bin/bash -
Download .net core SDK: Now we will need diagnostic tools and for the installation of these tools we need .net SDK installed since typically production containers won’t ship with these tools (unless you a sidecar). Get the relevant SDK from https://dotnet.microsoft.com/download/dotnet-core.
You could use a command like below on Linux shell (this is for .net core 3.1, use a different link for .net 5):
curl https://download.visualstudio.microsoft.com/download/pr/ec187f12-929e-4aa7-8abc-2f52e147af1d/56b0dbb5da1c191bff2c271fcd6e6394/dotnet-sdk-3.1.404-linux-x64.tar.gz --output dotnet-sdk-3.1.404-linux-x64.tar.gz -
Extract and install .net core sdk:
mkdir -p "$HOME/dotnet" && tar xzf dotnet-sdk-3.1.404-linux-x64.tar.gz -C "$HOME/dotnet" export DOTNET_ROOT=$HOME/dotnet export PATH=$PATH:$HOME/dotnet -
Switch to dotnet folder:
Although we added dotnet directory to the path, it is likely the dotnet runtime binary will have priority so we need to switch to the directory which we have extracted the zip file:
cd ~/dotnet -
Install the tools:
./dotnet tool install --global dotnet-counters ./dotnet tool install --global dotnet-trace -
Add tools directory to the path:
In order to access the tools, we add tools to the path
export PATH="$PATH:/root/.dotnet/tools" -
Observe the root process:
The default process runs with process id 1 in the container so:
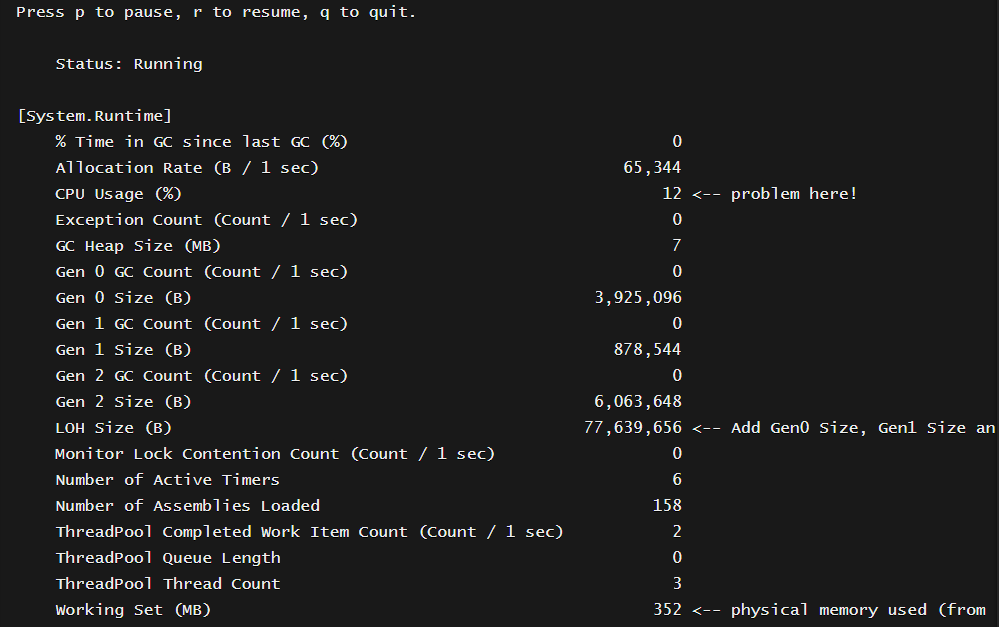
dotnet-counters monitor -p 1You see something like below (arrows added by me):
Press p to pause, r to resume, q to quit.

    Status: Running

[System.Runtime]
    % Time in GC since last GC (%)                                 0
    Allocation Rate (B / 1 sec)                               65,344
    CPU Usage (%)                                                 12 <-- problem here!
    Exception Count (Count / 1 sec)                                0
    GC Heap Size (MB)                                              7
    Gen 0 GC Count (Count / 1 sec)                                 0
    Gen 0 Size (B)                                         3,925,096
    Gen 1 GC Count (Count / 1 sec)                                 0
    Gen 1 Size (B)                                           878,544
    Gen 2 GC Count (Count / 1 sec)                                 0
    Gen 2 Size (B)                                         6,063,648
    LOH Size (B)                                          77,639,656 <-- Add Gen0 Size, Gen1 Size and LOH size to find out total managed memory
    Monitor Lock Contention Count (Count / 1 sec)                  0
    Number of Active Timers                                        6
    Number of Assemblies Loaded                                  158
    ThreadPool Completed Work Item Count (Count / 1 sec)           2
    ThreadPool Queue Length                                        0
    ThreadPool Thread Count                                        3
    Working Set (MB)                                             352 <-- physical memory used (from container/pod point of view)
Here we observe several performance counters. We can observe the CPU percentage to find out if this is a CPU bound problem. If you see a number stuck to 12 or 15 or 25 and not much fluctuating, be careful, it is likely this means you are using 100% of a single core and since you have many cores, the tool only shows a number like 12 (100/8 cores) Also as of now there is no built-in performance counter showing total private memory consumption including the unmanaged parts.
-
Collect a perfview trace:
dotnet-trace collect -p 1Wait like 60 sec, then stop by hitting CTRL+C, In my case, it creates a file:
Output File : /root/trace.nettraceThis is a trace file you should open via a tool like perfview. This kind of trace will include wall-clock thread-time (find the slowest functions including I/O), all exceptions and other memory statistics.
-
Download the trace file: Once you collected the trace copy the file from container to your local
kubectl cp -n <name_space> <pod_name>:<path_to_source_file> <local_path_including_the_file_name>where path_to_source could be
/root/trace.nettracewhereas local_path_including_the_file_name could betrace.nettrace.For docker only use below:
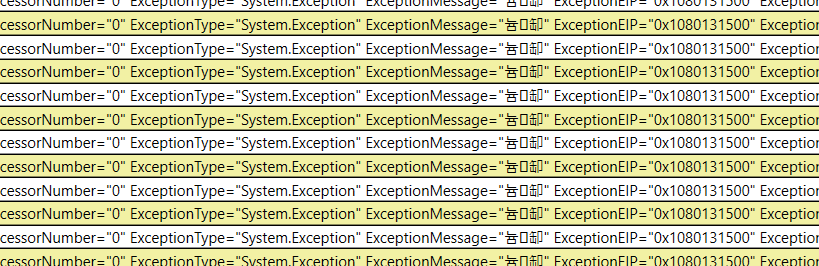
docker cp <container_id>:<path_to_source_file> <local_path_including_the_file_name>Then when you open the trace file with Perfview (Use the latest perfview, not trace view) you could see wall clock CPU analysis:
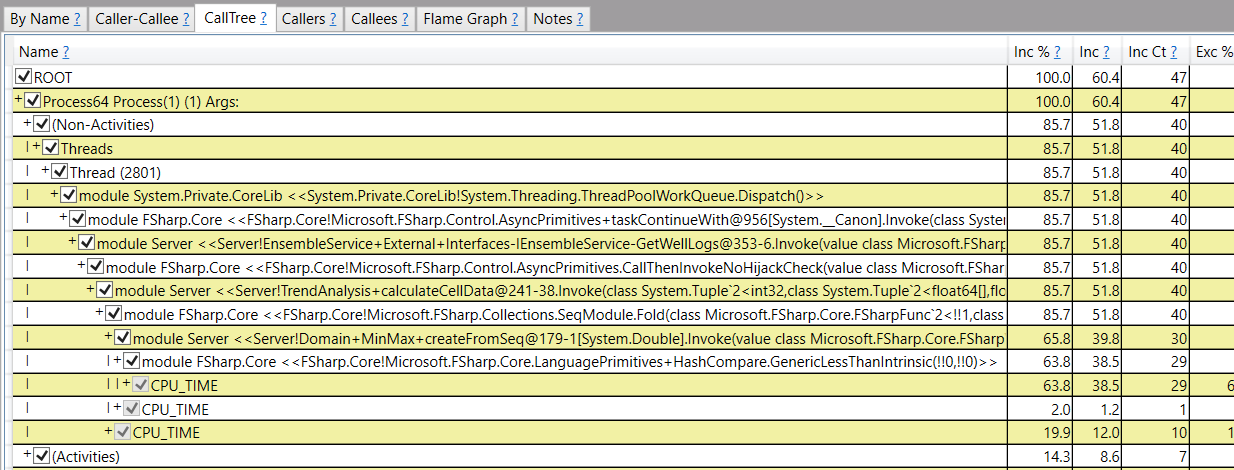
Or the exceptions: