
Common misconceptions about diagnosing memory and CPU problems
As a developer, diagnosing problems is an important skill, almost as important as our developer skills. But misdiagnosing things can lead to more problems. Let’s address some common misconceptions about diagnostics:
Mistake #1: I use task manager processes tab on Windows to find out memory usage for a process
Typically on the windows platform when we are asked how much memory is consumed by a process, what we do is to fire up task manager and look at:
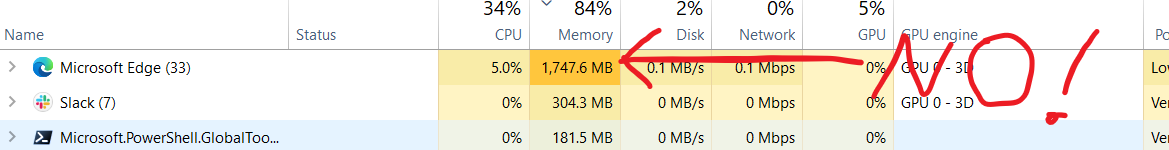
If you measure the memory consumption as above I have one word for you: Ouch! What you are looking at is actually the Working set which means that’s only the physical memory consumption. But it is quite possible, a significant portion of your process may not be on the physical memory but on the disk. Windows memory manager will happily put the less frequently accessed pages to the disk. Then what should we do? It’s the commit size (or private bytes from perfmon) that is what we want. You could see the commit size for a process as below from details pane of the task manager:
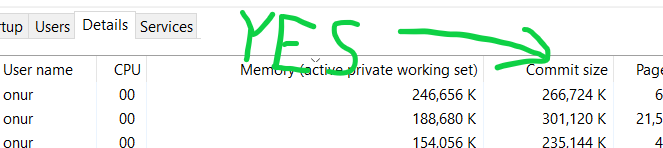
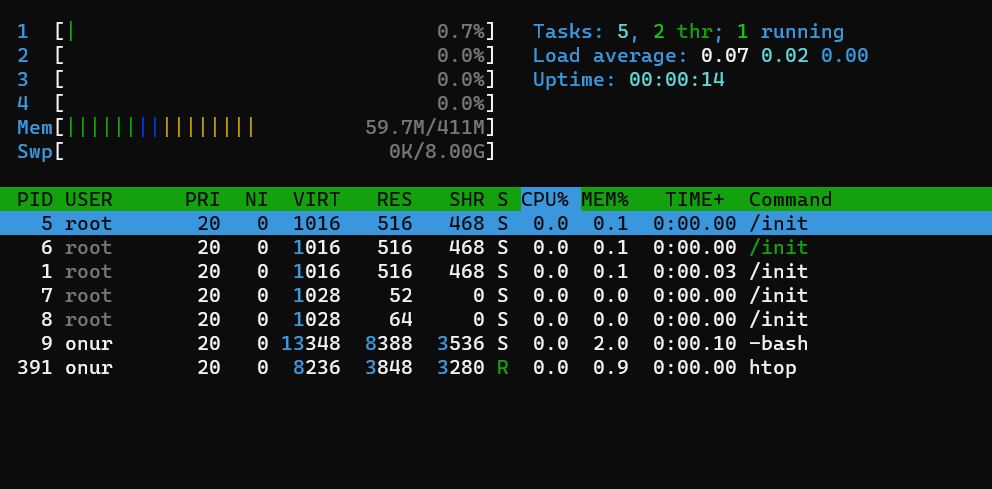
By default commit-size column won’t be visible. If so, right click to the columns and add it. To sum up, avoid anything that contains the term “Working Set”. On Linux, you can rely on VIRT column with htop.
The true memory consumption of a process is a complicated matter as there is a shared part of it. But Committed memory (or private bytes from perfmon) and VIRT from htop is roughly accurate assuming you don’t use things like memory-mapped files.
Mistake #2: My system has 16 GB RAM whereas my app uses around only 800 MB, so it is unlikely that I will get Out Of Memory Exception
Both Linux and Windows operating system tricks the process such that for 64 bit-processes, the process believes it has terabytes of RAM available. But for 32-bit processes, they only have 4GB Ram available! And half of it is reserved for the kernel space that means only 2GB RAM available to your process if it is 32-bit.
Ok, even if we have 2 GB, but I still have 1.2 GB to go. Not quite! If your process is a .NET process, then the managed memory is splitted in several sections. Whenever the garbage collector triggers, it will defragment the memory for you, so that the managed memory allocated is a single piece if we exclude the pinned items. But there is one section called Large Object Heap in which larger objects are put (since defragmenting larger objects are expensive, they are put there). And by default, this section is not defragmented. As a result, it is possible that we could have some sort of cheese like memory with a lot of small holes.
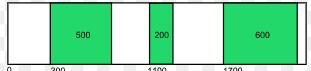
So even though we have 1.2 GB RAM available if the largest contiguous space available in our large object heap is let’s say 1MB and we attempt to allocate 2MB then boom! we have an OutOfMemoryException
Mistake #3: My system has 16 GB RAM whereas my app uses around only 20 GB, my system will slow down or even crash
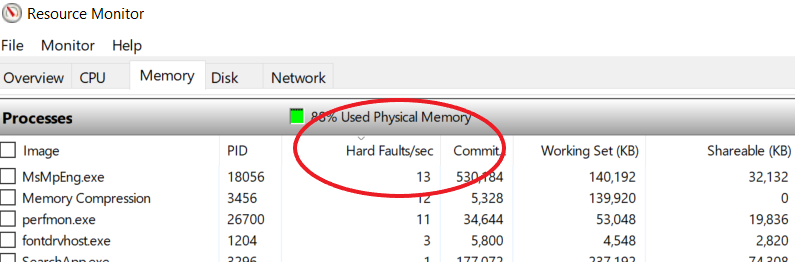
Not necessarily! If your app isn’t accessing some pages frequently those pages will remain dormant on the disk. The real slowness wouldn’t be because of high memory usage. But due to hard page faults. A hard page fault (on Linux it is called, major page fault) happens, when the memory manager cannot find the requested page on the physical ram, so it loads it from the disk. And that is really slow. But if you don’t cause a page fault, there is not much problem excessive memory is spilled to the disk since you don’t read this memory.
In Windows, I am aware of only one place that shows the hard page fault per second, and not aware of any command-line access to this value:
In Linux, you could use the following to see major page faults:
ps -o min_flt,maj_flt <process_id>
Mistake #4: My app is using only 25% of CPU so it should be working fine
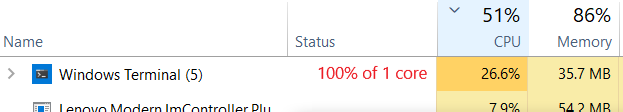
This problem is mostly Windows-specific as htop on Linux behaves more sanely. On Windows taskbar, the percentage you see is divided among the logical cores. So a fixated number like 8,12,15,25,50 could be 100% of an entire logical core (100 divided by the # of logical cores) and this usually indicates that your process having a CPU bottleneck. See how htop shows CPU consumption as 100% properly below:
