
The snapshot of a memory snapshot for Chrome & Edge
While the web apps slowly replacing desktop apps, they are growing more and more complex which in turn they are becoming more memory intensive.
Perhaps a decade ago a front-end developer wouldn’t much be concerned about possible memory leaks but considering growing the complexity of our applications, analyzing memory leaks is becoming
a necessary skill. For apps that run inside the browser, in particular, Chrome/Edge, your first line of defense (and perhaps the last unless you attempt to debug v8 engine itself)
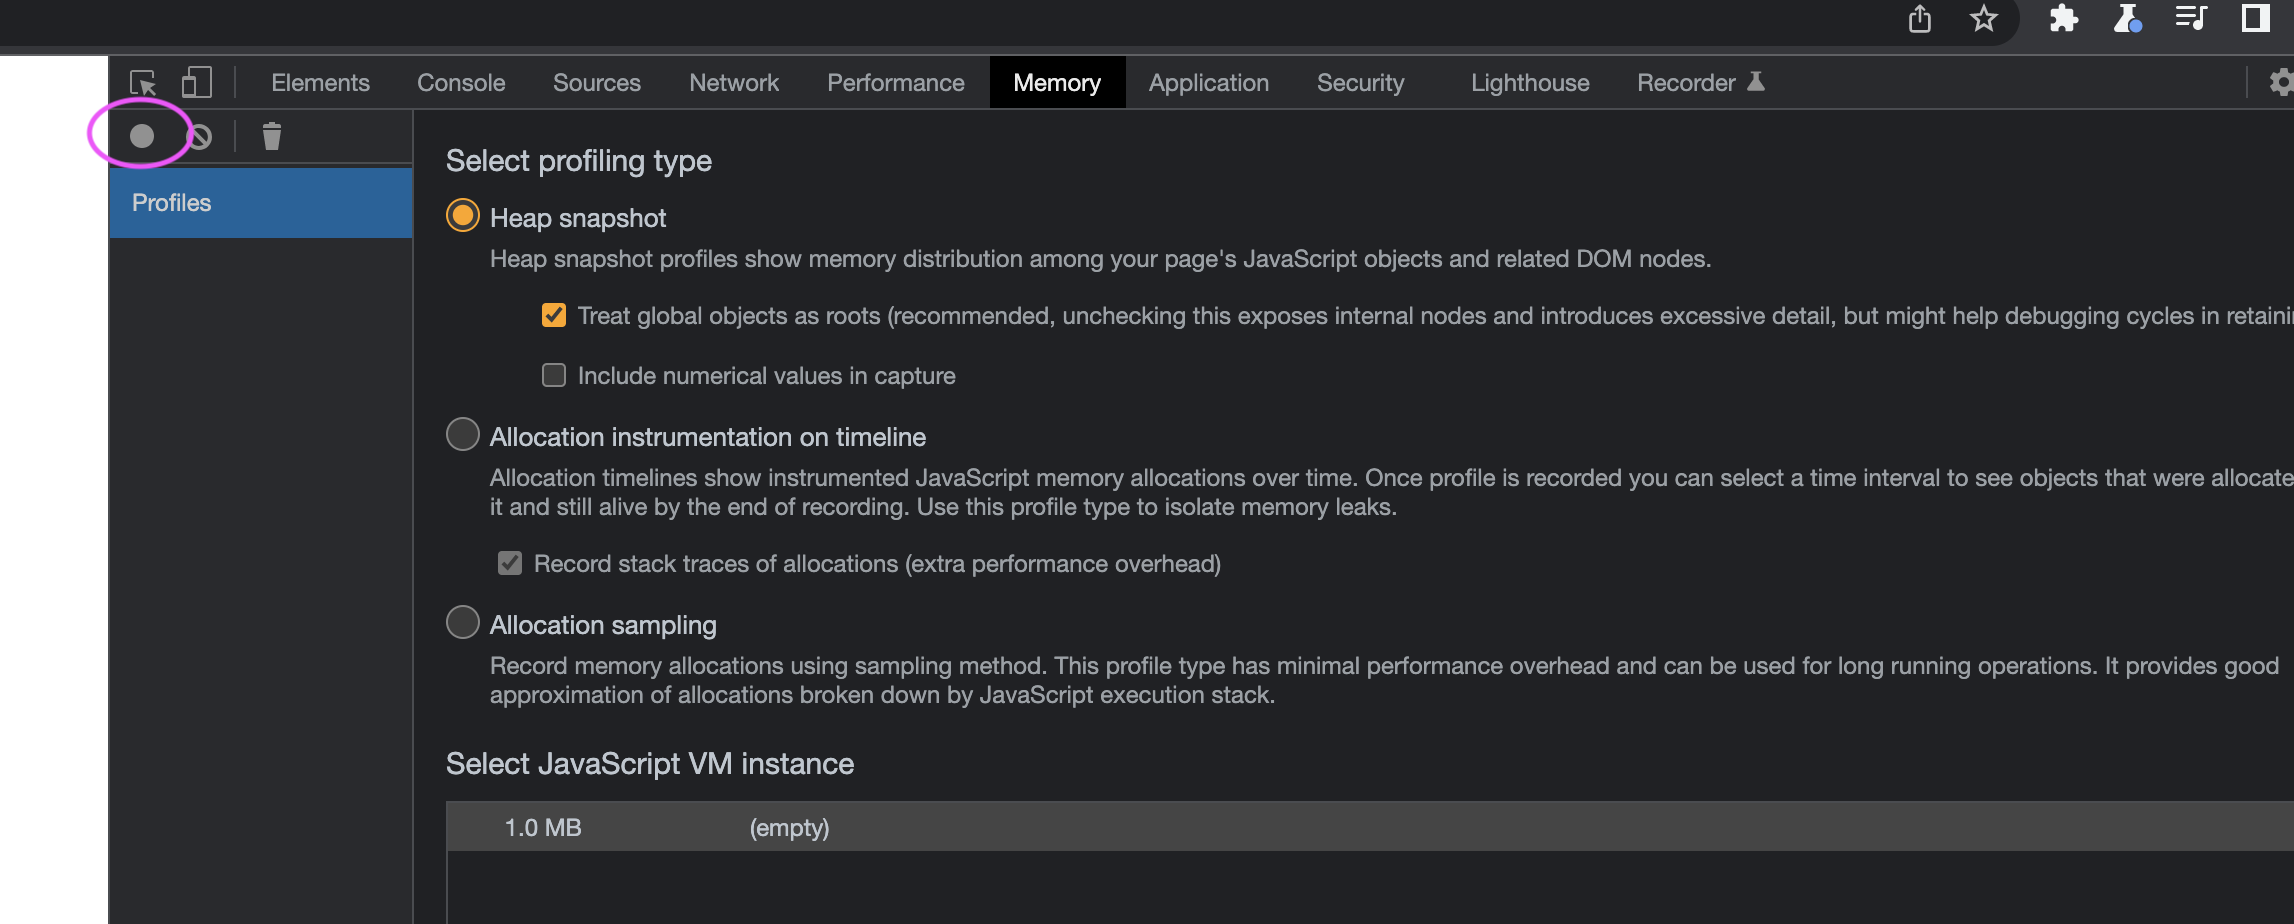
is the memory snapshot tool. And it is rather surprisingly easy to use. You open your developer tools go to the memory tab and take a snapshot.
The story of shallow size and retained size.
There is a gazillion of tutorials on how to do memory analysis or on how to avoid memory leaks. In this post, however, I’d like to discuss the simple-looking but
one of the most confusing aspects of a memory snapshot. That is the columns of the snapshot table namely ‘Distance’, ‘Shallow Size’, and ‘Retained Size’. While Distance and
Shallow Size is fairly easy to grasp, the most critical one Retained Size is a different story. We will be doing some experiments in order to understand what these columns are and how could we utilize them. For this experiment, I’ll be using Chrome Canary build, Version 99.0.4775.0 (Official Build) canary (x86_64) to have the least bug-free (ironic, I know) experience. If you are going to follow me along, I’d suggest you do the same and make sure there are no extensions installed, or at least they are disabled as browser extensions can interfere with the analysis.
To have a controlled environment I’ll be using about:blank url. Next let’s fire up our console from dev tools and create two classes. We type the following to the console:
class FooA{}
class FooB{}
window.fooA1 = new FooA();
window.fooA2 = new FooA();
window.fooA1.fooB = new FooB();
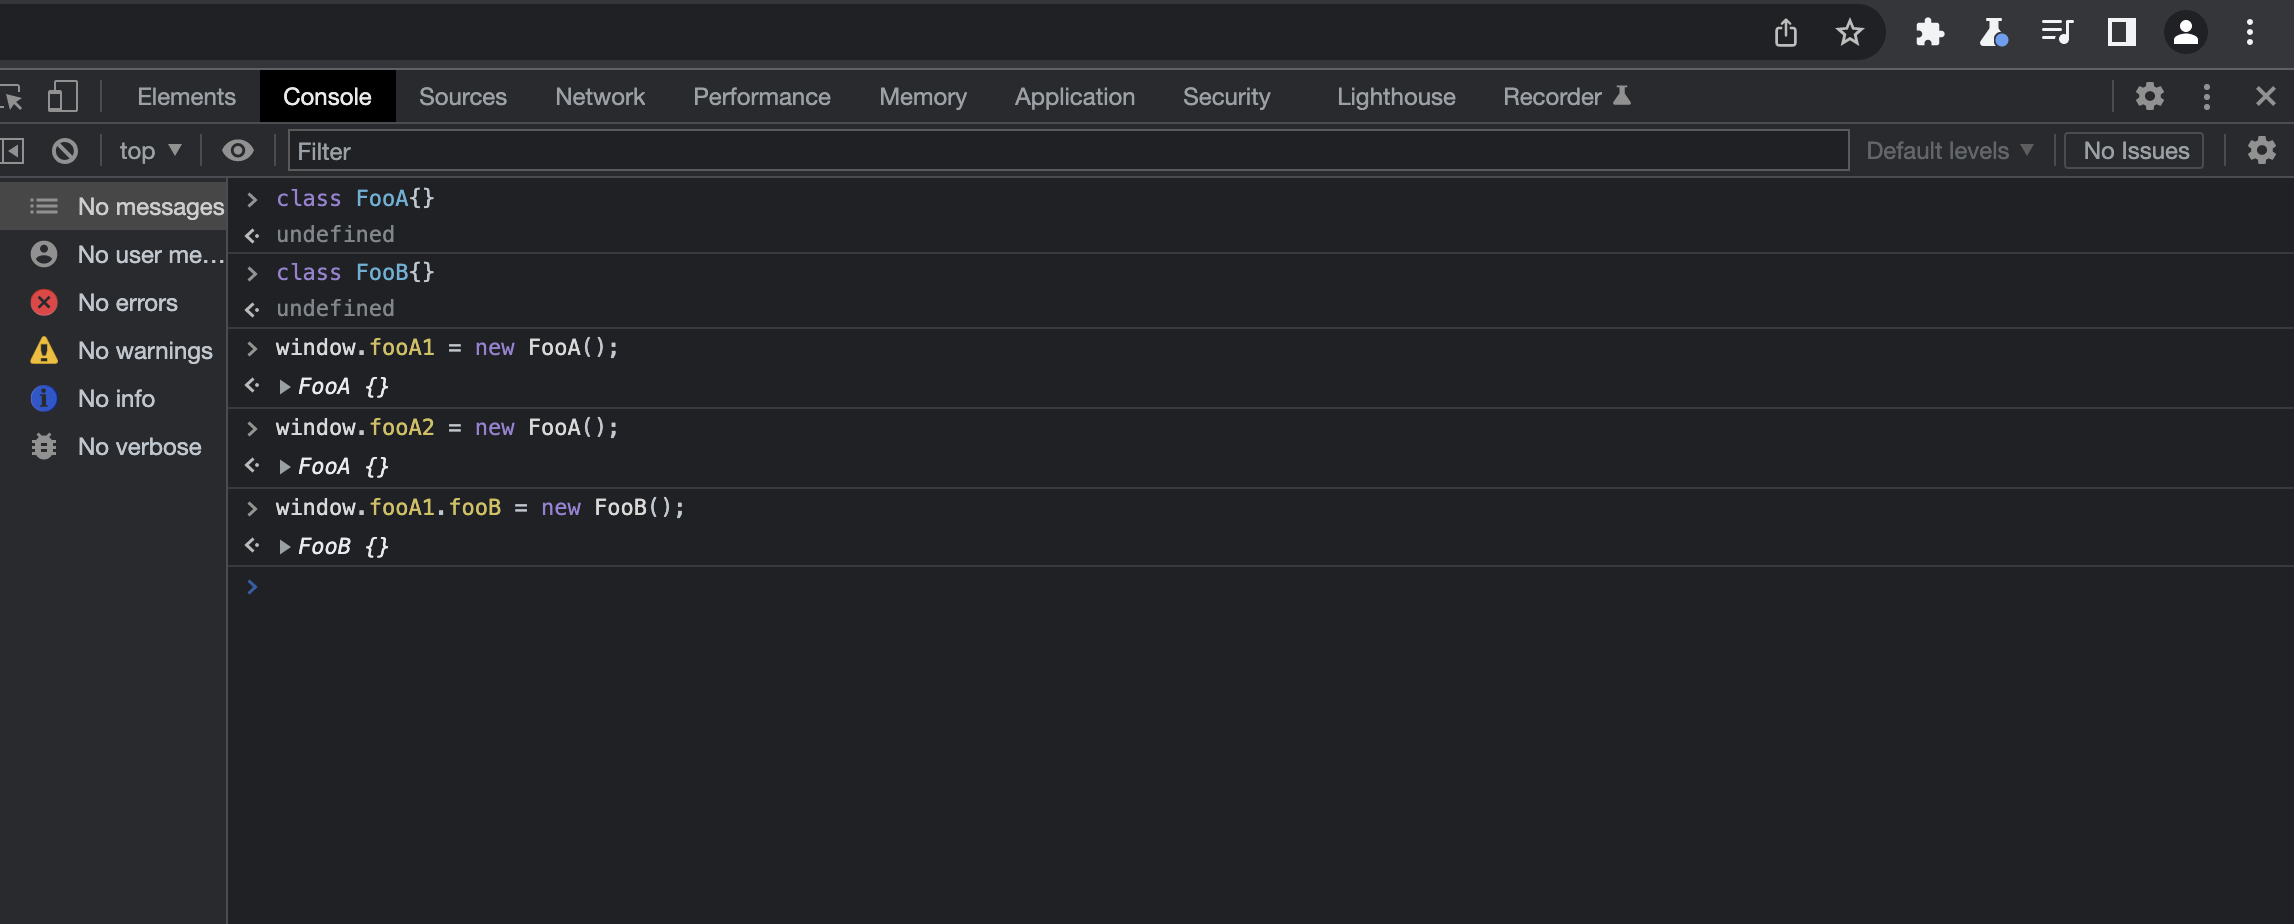
We have created two classes FooA and FooB, we attached 2 instances of FooA to the window and then we attached an instance of FooB to a FooA. Here we use window because the window is a direct child of a GC root which in turn will permanently hold these objects until we clean them. We don’t want the objects to be garbage collected right after we closed the console.
The next thing we do is to clear the console, switch to the memory tab, close dev tools and reopen it. I do this as a general practice to prevent the console itself from interfering with my analysis but note that each time you close dev tools, you will be losing the previous snapshots you have taken any unless you saved them. So be careful when closing dev tools if you are doing a snapshot comparison.
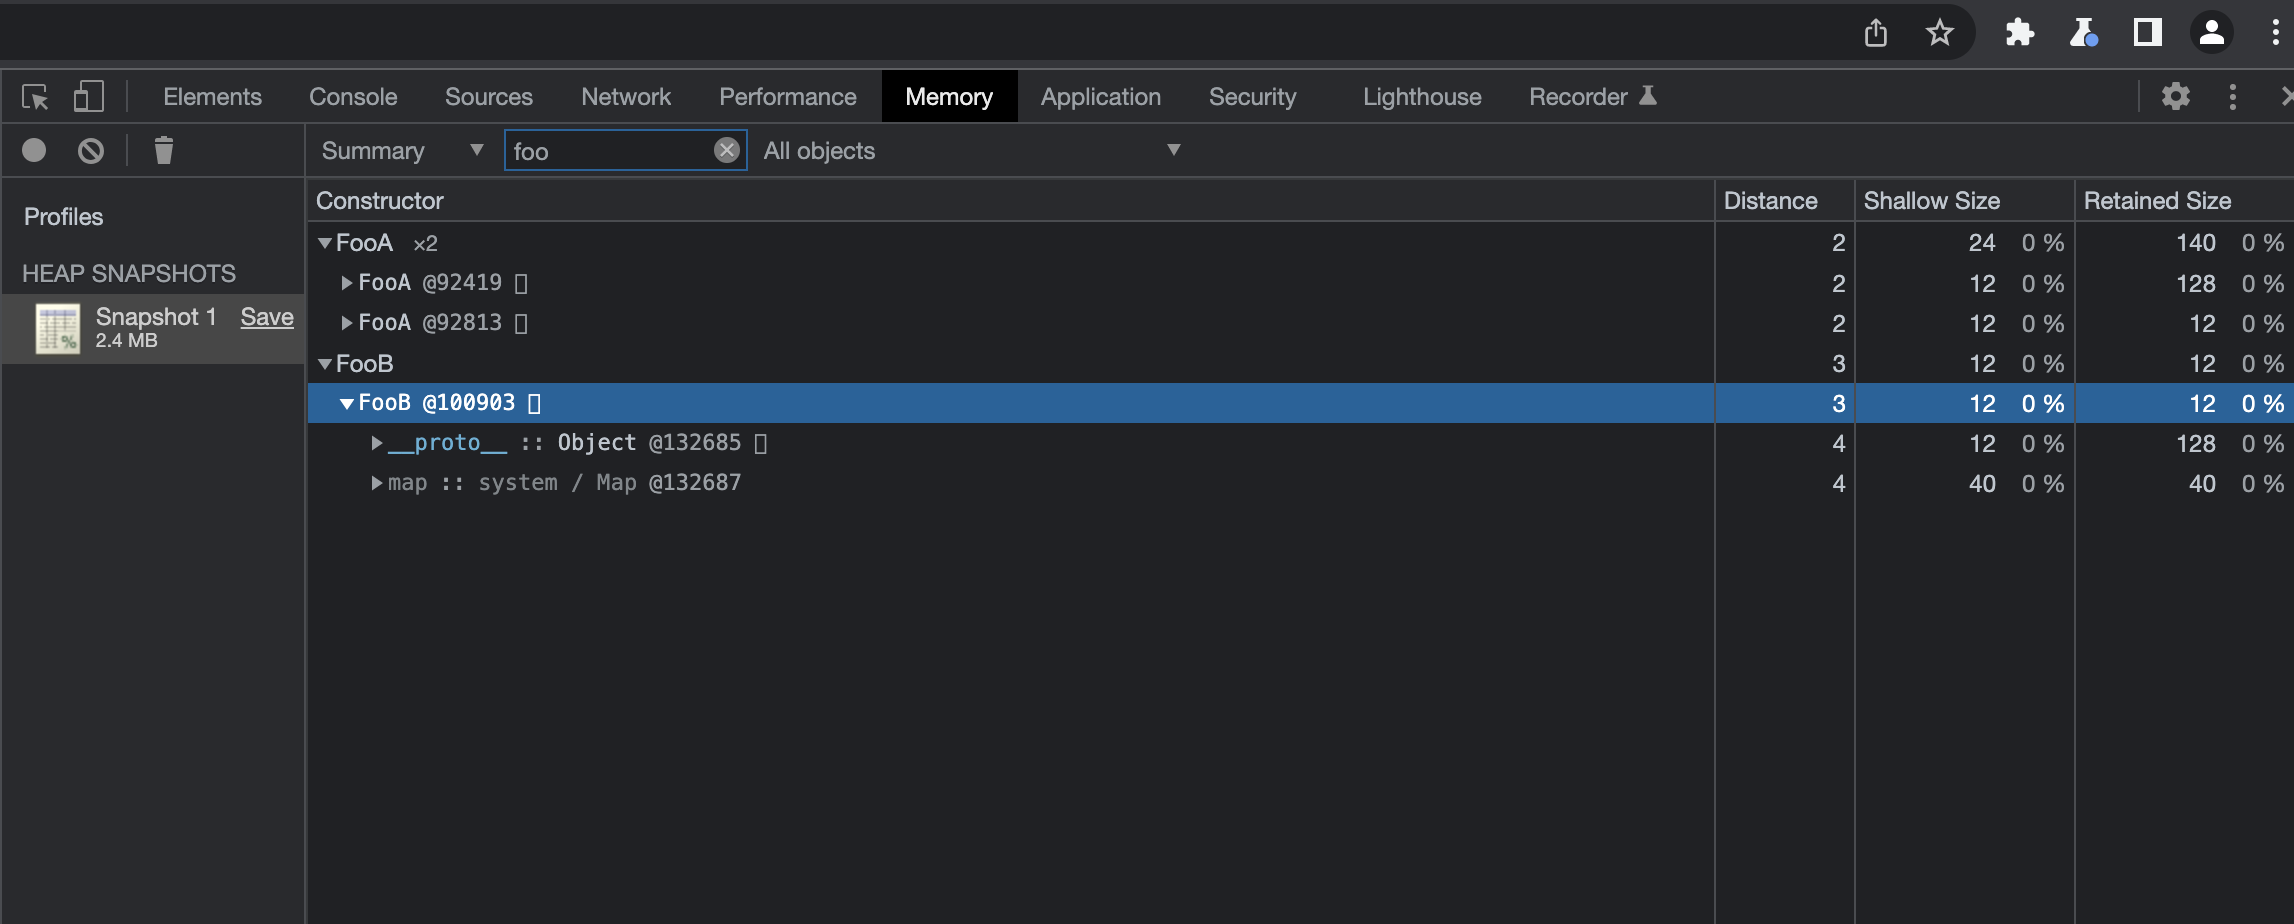
Once the dev tools is reopened, click to take snapshot button, and once the snapshot is done, search foo in the summary pane. Once we expand FooA and FooB then should look similar to below:
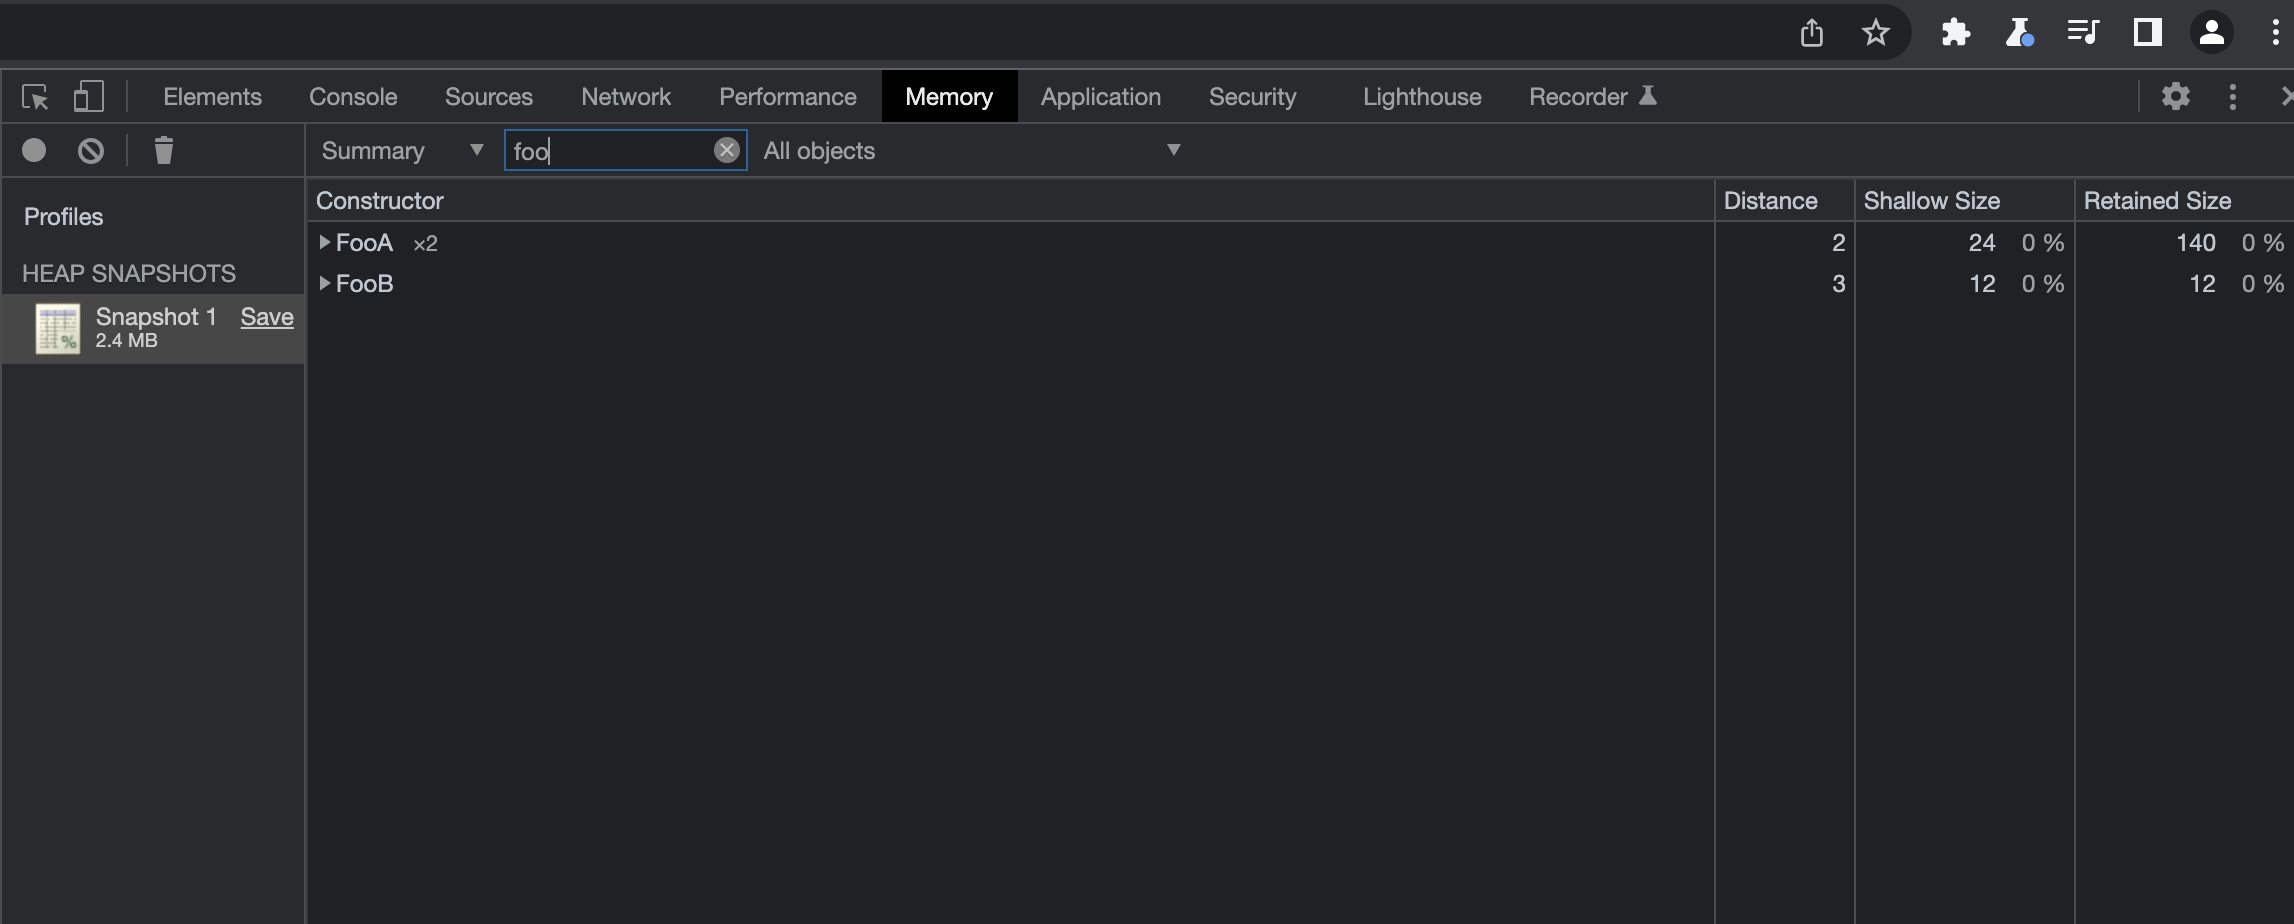
We can see our 2 FooA instances and a FooB instance. So let’s try to understand what’s going on here.
Distance
The distance value for FooA instances is 2. That’s very natural because the distance refers to the shortest distance to the GC root. Earlier we mentioned the window object is a direct child of GC Root so the window’s distance is 1. Both FooA’s are a direct child of the window so their distances are 2. What about FooB, well it is the child of one of the FooA instances so the distance of it is 3.
This is as in:
GC Root ---1---> window ---2---> FooA ---3---> FooB

GC Root ---1---> window ---2---> FooA
A memory snapshot is like a graph and distance helps us to identify how far that object is distant from the GC root. Generally, the closer the objects to the root, the more significant they are. But on the overall distance may not be a very interesting property.
Shallow size
Shallow size represents the memory that is held by the object itself. It is rather hard to estimate this size because it is implementation-specific and usually this memory is used for objects’ own description. For common objects types and classes, the size is typically less than 100 bytes per object. In this particular example, we see they are 12, but you may see different values such as 28 or 52 and it can even change during the lifetime of the same object. Since the size is usually small, Shallow size isn’t usually a concern. There are two main exceptions to this rule. For strings and array-like objects, they have their shallow size counted based on their content lengths and it is fairly common to see arrays and strings with large Shallow sizes. Also, some dom elements also behave like an array internally and they can also have significant shallow sizes. Finally, even the shallow size is small for regular objects, if you leak thousands of these objects, these small shallow sizes would add up to a big value.
Retained size
Now we have arrived at the most important part of our story. Please read the definition carefully even multiple times because it may not be the thing you were expecting: Retained size is the size of memory that is freed once the object itself is deleted along with its dependent objects that were made unreachable from GC roots.
In other words, if we ask GC the following question: How much memory we would gain at this point if GC runs now and this object wasn’t held by any other objects. If that particular object wasn’t held by any other objects, the object and all its dependents which are solely relying on it would have been cleaned and we would gain that much amount of memory back and this precisely represents the Retained size for our object.
In our example for the Foo B instance, we see the retained size is 12. Obviously retained size can’t be smaller than the shallow size since that would be the minimum we would gain if the object is cleaned up:
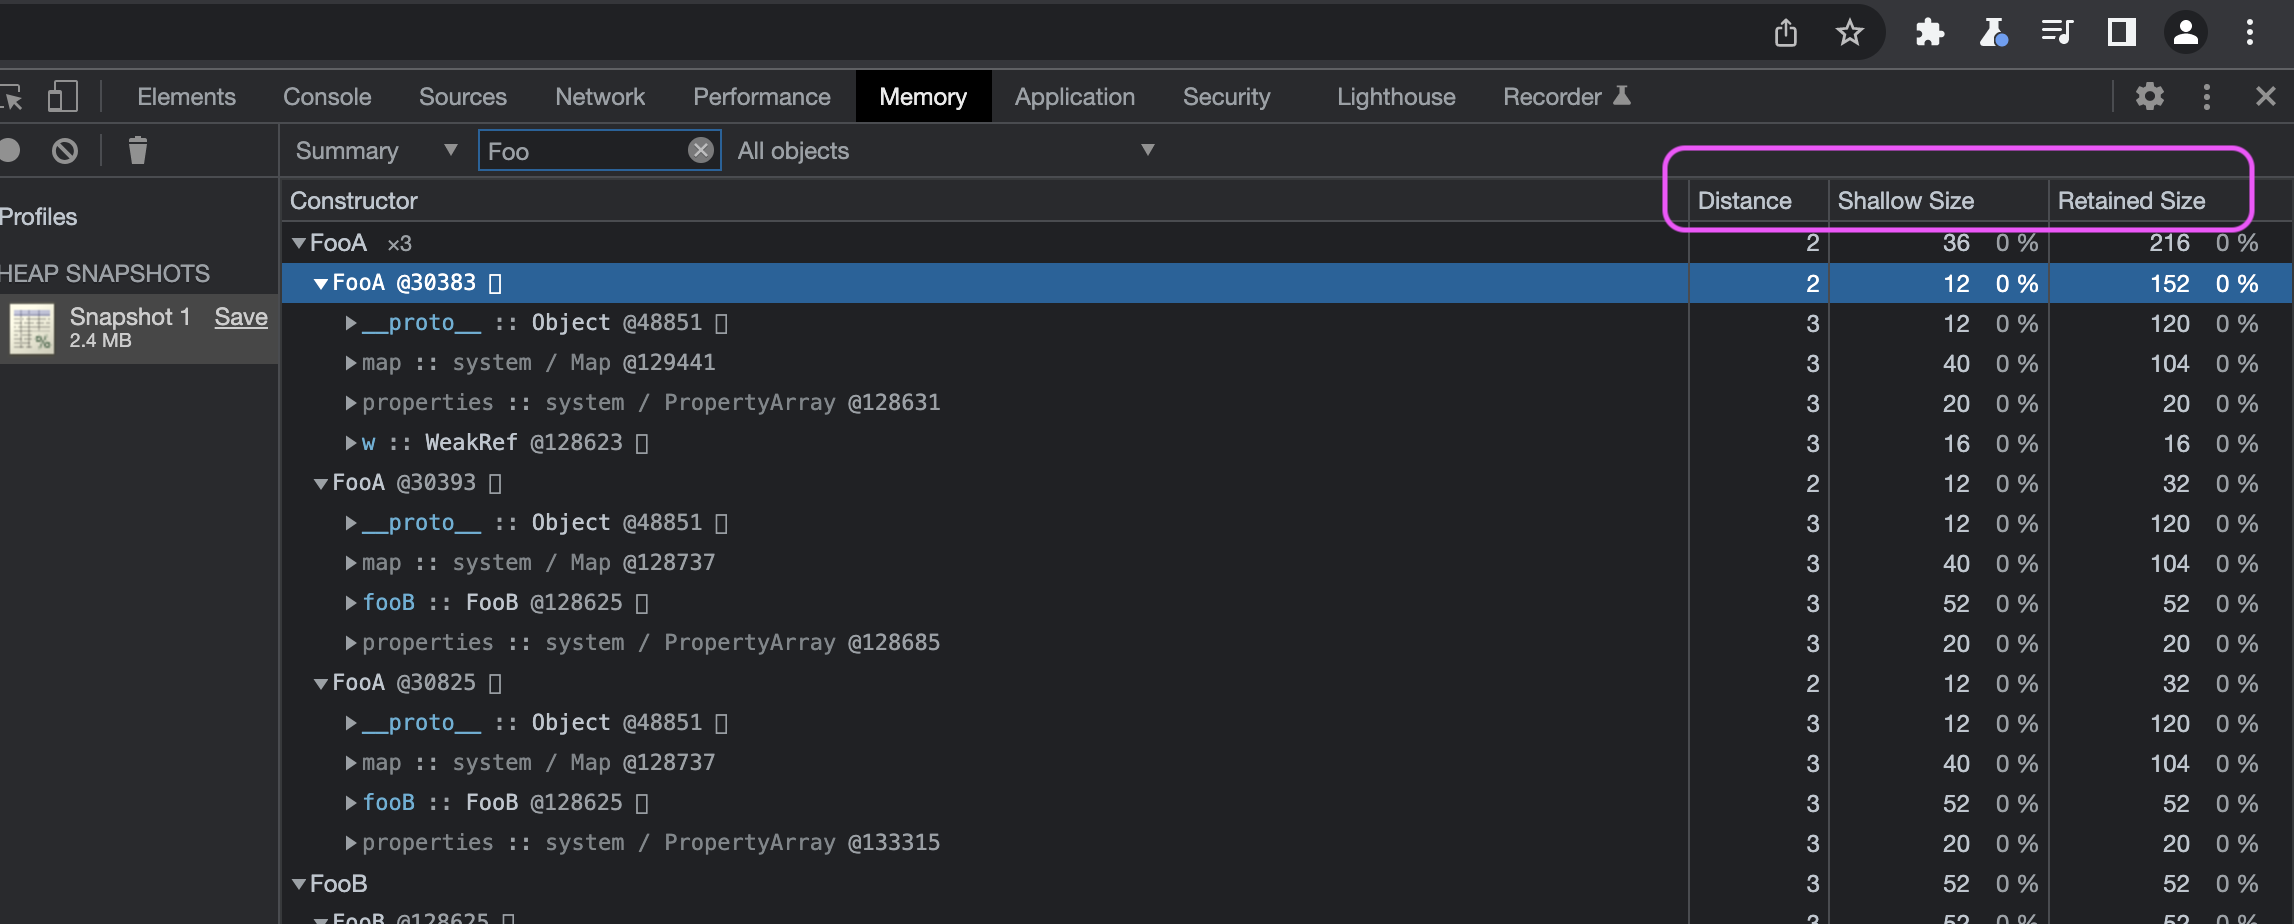
If we look at the properties of FooB as in above, we see two particular items. __proto__ and map. __proto__ represents the prototype of this class and map contains a description and offsets of the properties (more on that later). Both of these properties are actually affiliated with the FooB class/type itself, not with the particular instance. In other words, even if the FooB instance is garbage collected, the FooB as a type is still there since we declared it as a class and we could create subsequent instances. That’s why __proto__ and map for this type is not included in the retained size. Therefore for FooB our retained size is the shallow size, 12.
If we look at the FooA instances however, we see something a bit peculiar. The first FooA instance having retained size is 128 and the second ones is 12. I think you can see why the second FooA’s retained size is 12 since it is the same case as above. Let’s look at the first FooA:
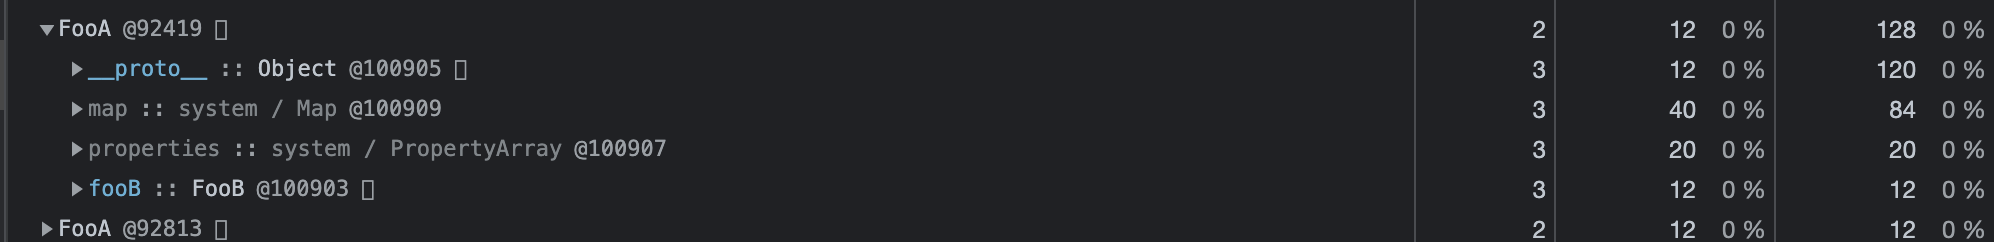
For FooA we have a retained size of 128. Where does this number come from? Obviously, we have 12 bytes for the shallow size. The thing is since we have executed the following line window.fooA1.fooB = new FooB(); this caused some disturbance in object’s description mapping. Because we attached a new property to FooA, our original map describing the type isn’t valid anymore so v8 creates a new map, specific to this instance (since this is the only FooA instance with fooB property). Each map object has a back pointer to the map is derived from but that doesn’t matter. In this case, this map is specific to this FooA and if this FooA is gone then the map is gone hence we gain 84 bytes from there. So far 84 + 12 = 96. Since FooA is the only object that holds the FooB instance and if FooA is gone, FooB will also be gone so we add 12 for FooB making it 96 + 12 = 108 visible as foob property above. We still need 20. And you can see we have a new property property that contains. Phew, quite a bit of calculation!
But we are just getting started. Let’s execute the following in the console.
window.fooA2.wref = new WeakRef(window.fooA1.fooB);
Then clear the console, switch to the memory tab, close the dev tools, reopen it and take another snapshot and search for foo. Then we see the following:
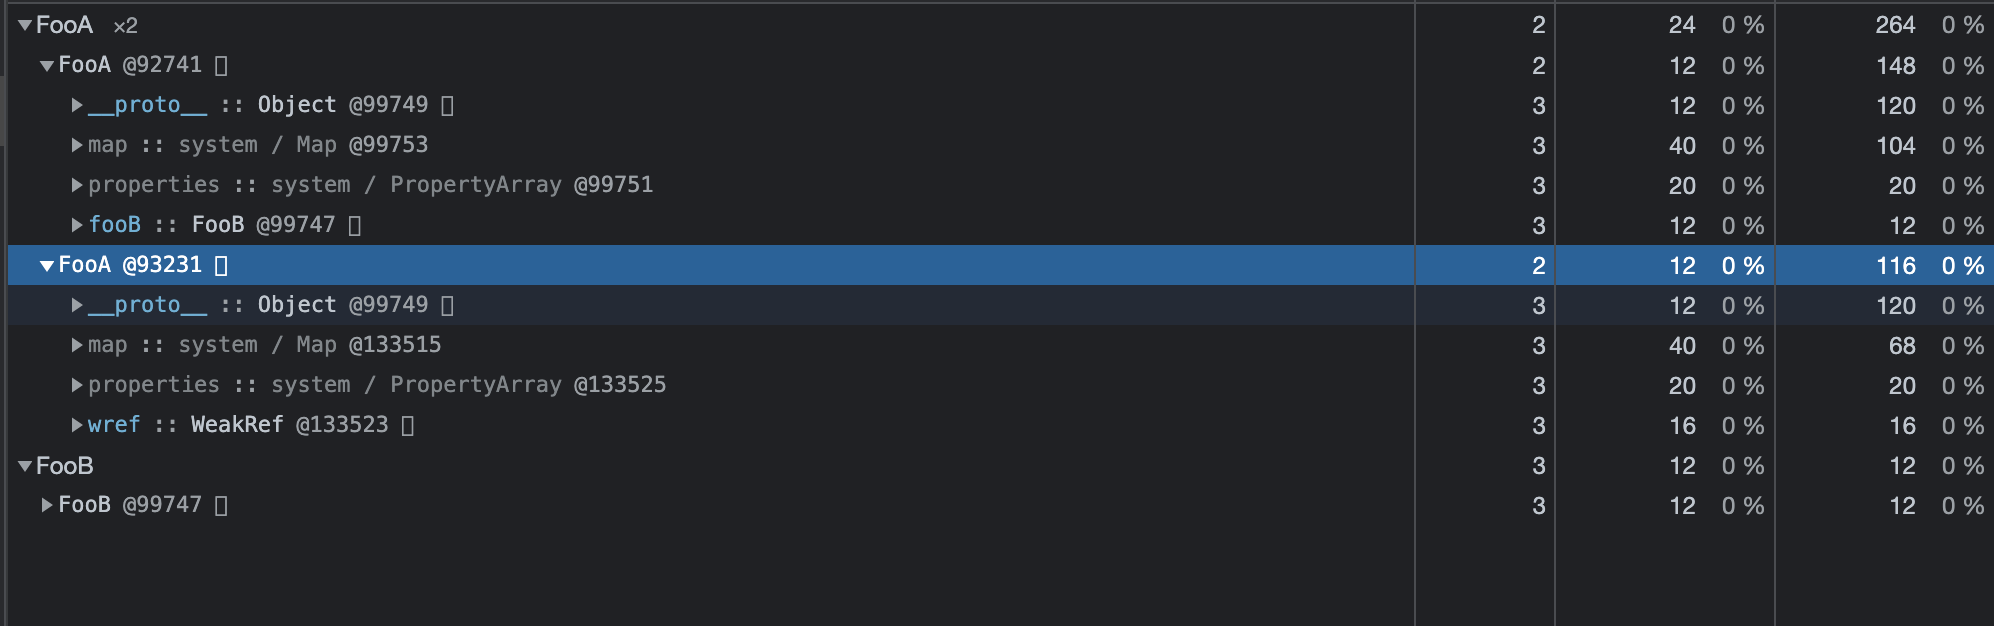
There is no change in FooB as expected but the first FooA has been grown 20 bytes. And if we dig into that we see, first FooA’s map property was the only thing that grew 20 so it adds up again. Why did the first FooA’s map change when we added a property to the second FooA? It’s an internal thing but possibly the map is forked and grown to a tree now.
                       |--> Map for FooA with fooB prop
Map for orignal FooA ->
                       |--> Map for FooA with wref prop
If we check the second FooA then we see a picture similar to an earlier case. The only difference is the property we have is a weakref to B and weakref itself has a size of 16. Weakrefs never cause the object to retain. That’s the purpose of WeakRef’s after all. They are weak references and GC just ignores them as holders. As a sum, we have 12(shallow) + 68(map) + 16(wref) + 20(properties) = 116. Great, that adds up too. Now let’s try something different.
This time we execute:
window.fooA3 = new FooA();
window.fooA3.fooB = window.fooA1.fooB;
We create a new FooA instance, assign it to fooA3 then we assign FooA1’s fooB to fooA3’s fooB.
And again we clear the console, switch to the memory tab, close and reopen dev tools, take a screenshot and search for foo:
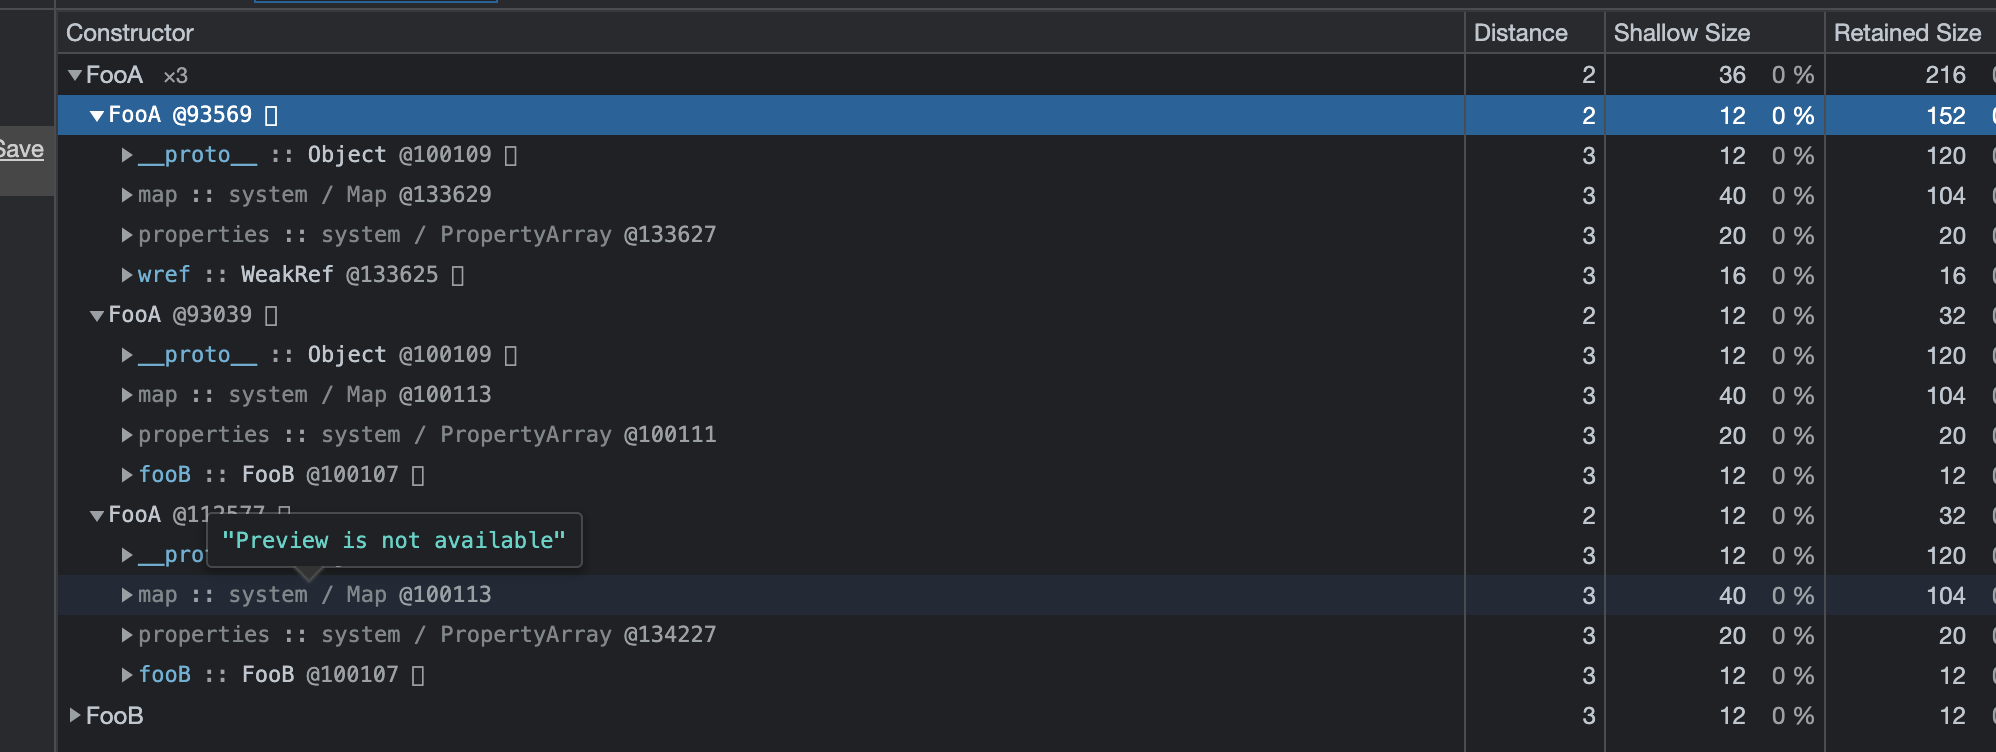
No change for the retained size of FooB which is expected. The FooA with wref has further grown from 116 to 152 and this can be attributed to its map property being grown to 36 bytes for whatever reason (due to we have to 2 instances of FooA and there is a enumcache mechanism internal to map which is the root cause.)
But the most peculiar thing is for the other two FooA’s our retained size has dropped to 32! Well, we would expect them to be equal since both are identical, but the interesting bit is just because I created another instance of FooA and assigned a fooB to that, the original FooA with fooB’s retained size dropped. What’s going on here?
The answer lies within the definition of retained size. In particular, they are both owners of FooB now so if one is garbage collected, the other one will still keep FooB in the memory and vice versa. So the size of FooB cannot be counted into either of them. Their individual map properties are 104 bytes but because these two objects have identical properties, they also utilize and share the same map object! So map also can’t be included in either of the balances. All we have left is 12 bytes of shallow size and 20 bytes of properties for each of these objects and they are adding up to 32.
fooA1 --\
          \
           | --> FooB  <---weak ref--- fooA2
          /
fooA3-- /
As demonstrated above, since both of them are holding FooB, neither of them are the sole owner so FooB’s retained size is excluded from their retained size. It’s not included in the fooA2 because it holds FooB as a weak ref. So in other words FooB’s retained size is somewhat lost but only added to the grandparent window object. In some cases, the are other root objects such as WebSockets, network connections, other extensions and for those cases, some objects may never contribute to any of the retain sizes available if they are shared among multiple roots.
As we have discussed, retained size concept can be pretty confusing. What can we deduce from the retained size then? Well if the child’s retained size isn’t fully reflected to the parent, then it means it is held by other retainers which can be observed from the bottom of the pane in the Retainers section. If the parent and sum of the children’s retained sizes are close then the parent is likely to be the sole owner.
I hope this dispels the confusion about these numbers and you can have a more confident analysis next time when you look at your memory snapshots. In the next post, I will talk about the mysterious map property and why it does exist in the first place.